Raj Shah — data scientist and AI engineer
Data Scientist and AI Engineer
My name is Raj Shah. I work on backend architecture, quasi-experimental work, and AI systems, and I have a passion in civic tech. I thrive in the intersection of classical statistical methods with software engineering.
Projects

Diversity Analysis of 49 Seasons of Survivor
An interactive data journalism piece examining race, gender, and age representation across all 49 seasons of Survivor. Built with D3.js, featuring KDE ridge plots, funnel charts, stacked bars, and wage trend lines showing how the New Era changed casting.

Contract Year vs. Performance in the NBA
This project is an experiment in data-storytelling. I use D3.JS to visualize the relationship between contract years and player performance in the NBA. The project includes animated components and interactive components that allow the user to explore the data in a more engaging way.

What’s Driving the Decline in Batting Averages?
An investigation using Bayesian fixed-effects models on 240,000+ pitches to predict hit probability. Built using brms in R to implement Stan models and visualize pitch-level MLB data.
Achieving Fairness in Federated Learning
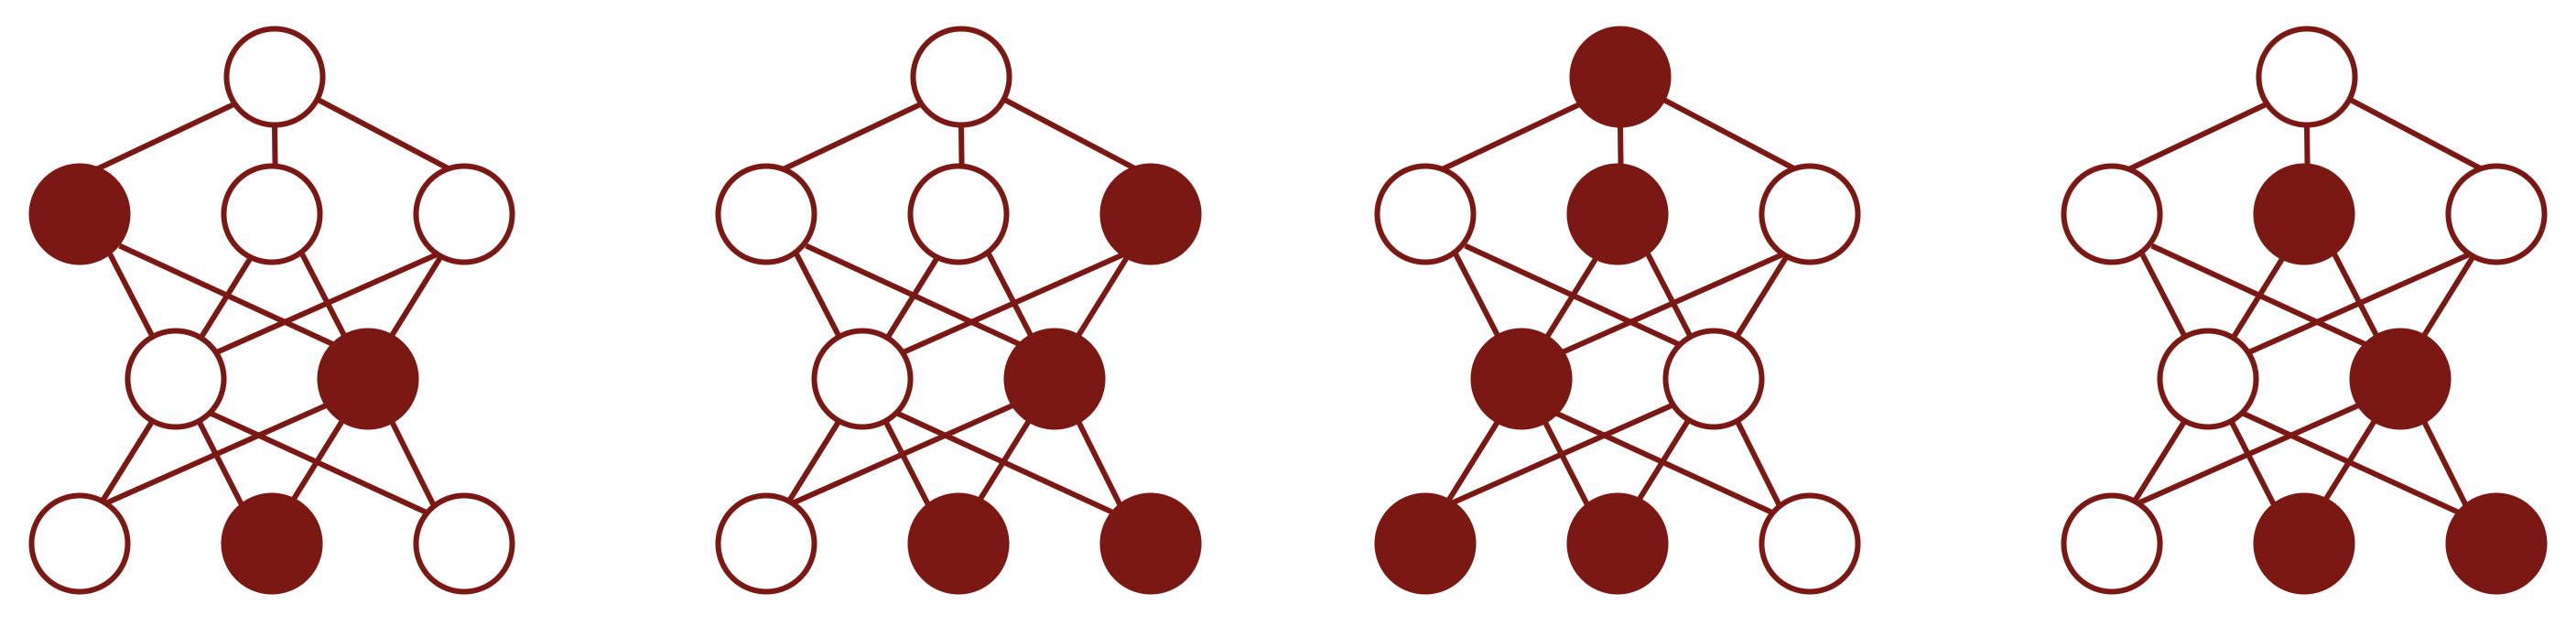
This group project implemented a novel approach to improve individual fairness in Federated Instances using the Flower framework. We trained a Neural Network model on recidivism cases from the COMPAS dataset, and were able to achieve increases in group and individual fairness metrics without sacrificing accuracy.
Reducing Voter Wait Times using Optimization
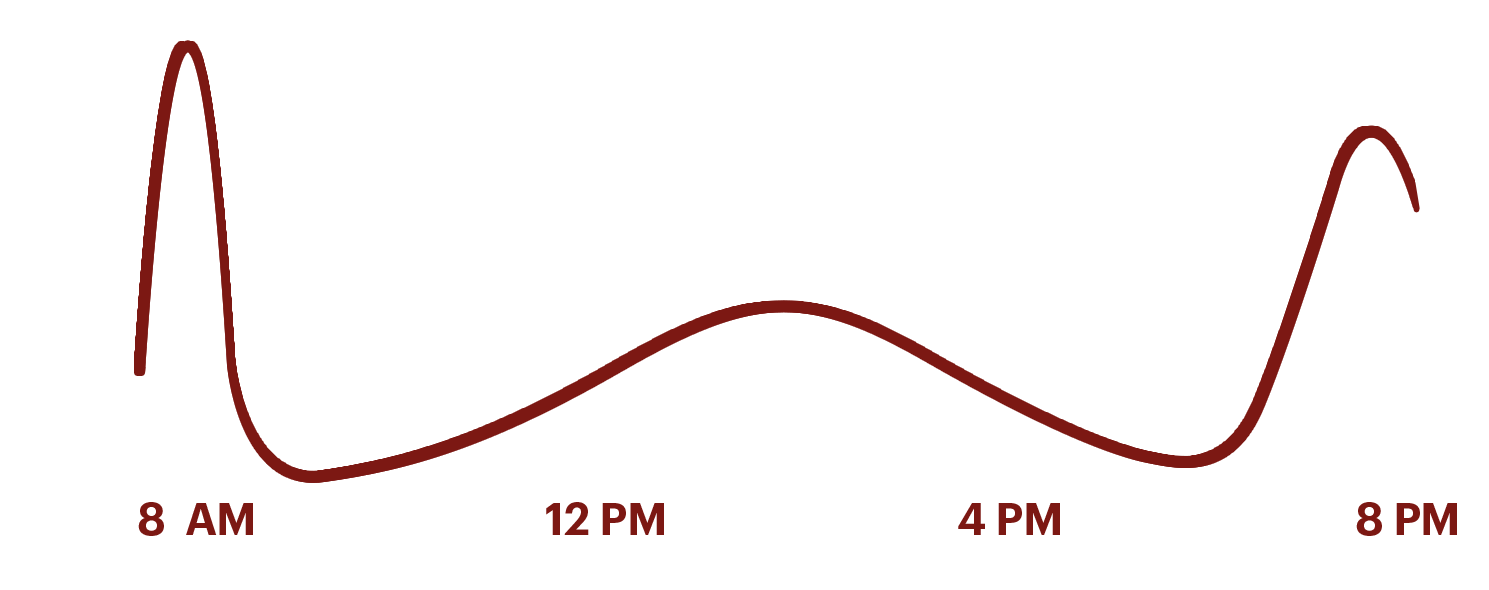
This project used optimization techniques to reduce voter wait times in Allegheny County. We used census data and historical voting data to create a model that predicts wait times at polling places. We then used this model to optimize the allocation of voting machines and poll workers to reduce wait times.

Changes in Industry in Pittsburgh using GIS
This ArcGIS Dashboard visualizes changes in occupational makeup across the greater Pittsburgh area. It uses historical census data with Multivariate Cluster Analysis to identify trends across different precincts. The dashboard allows users to stratify data by industry and by year.

Full-Stack CNN for Identifying GAN Media
This project uses a Convolutional Neural Network to identify GAN-generated media. The project was deployed on Amazon Web Services and was served via a Chrome Extension with React. The project achieved a precision of 88% on our test set and the project was a Top Ten Finalist in Booz Allen Hamilton’s 2019 Summer Games.
What Raj can do
Raj can blank.
Pick up a stamp!